About OptiRanker
OptiRanker is a powerful and user-friendly software that helps you rank options based on multiple criteria using the TOPSIS method. Whether you are evaluating projects, selecting suppliers, or making other decisions, OptiRanker provides accurate and reliable results quickly and efficiently.
Download OptiRanker
Resources
Application Areas and Case Studies
- Genotype Selection for Crop Breeding: OptiRanker can help in selecting the best genotypes based on multiple traits such as yield, resistance to pests, and tolerance to environmental stress.
- Crop Selection for Optimal Yield: The software can rank different crops based on various factors such as soil type, climate, and water availability, aiding in the decision-making process for optimal crop selection.
- Precision Agriculture: By evaluating various criteria like soil health, water usage, and environmental factors, OptiRanker supports precision agriculture to make informed decisions on crop management.
- Pest and Disease Management: OptiRanker can assist in identifying the best pest or disease management strategies based on their effectiveness, cost, and environmental impact.
- Agroecological Zone Identification: The software helps in identifying suitable agroecological zones for specific crops based on environmental and climatic conditions, ensuring better crop adaptation and improved yields.
- Case Study 1 - Genotype Selection in Rice: In a case study, OptiRanker was used to evaluate multiple rice genotypes based on their drought resistance, yield, and disease resistance. This allowed for the identification of the most suitable genotype for drought-prone areas.
- Case Study 2 - Crop Selection for Climate Change Adaptation: In areas affected by climate change, OptiRanker helped farmers select crops based on climate resilience, soil fertility, and water requirements, ensuring better crop productivity and sustainability.
- Case Study 3 - Multi-Criteria Decision Making for Fertilizer Use: OptiRanker has been used to rank different fertilizer options based on their effectiveness, cost, environmental impact, and ease of use, providing farmers with optimal choices for improving crop growth.
OptiRanker Screenshots
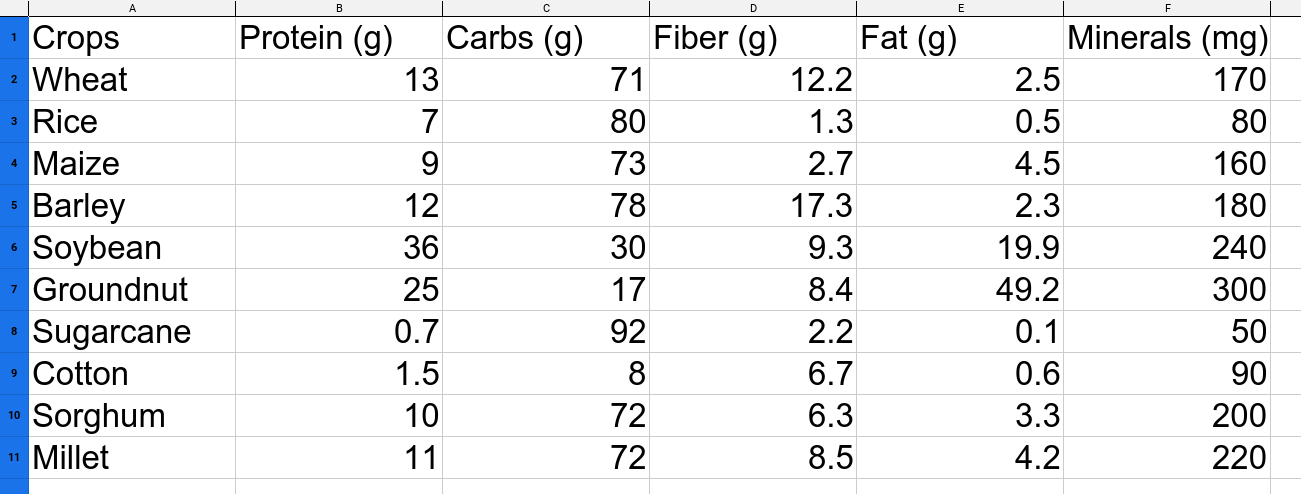
Input Example: .xlsx file
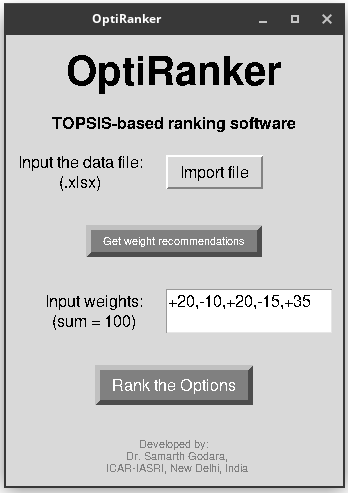
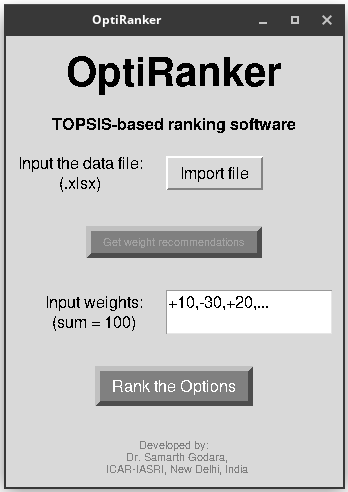
OptiRanker Interface
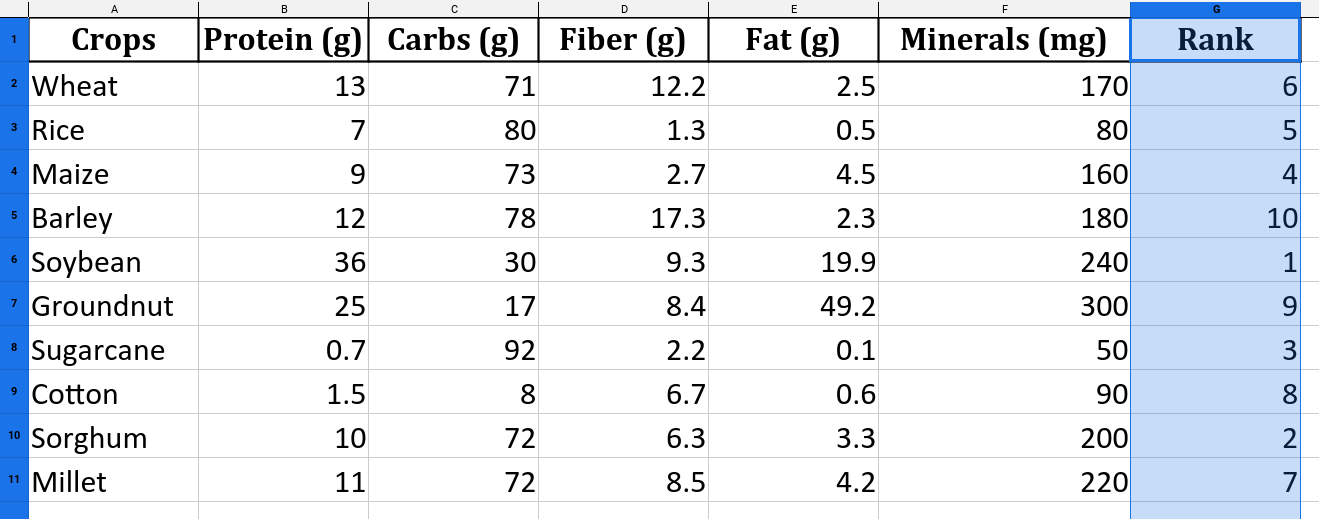
Output Example: .xlsx file
Input Format and Output Structure
To use OptiRanker, the input file should be in Excel (.xlsx) format. The file should consist of several columns, where the first column contains the options (e.g., crops, genotypes, or any decision alternatives), and the subsequent columns represent the criteria that will be used to rank those options.
Input File Structure:
- The first column must contain the options (e.g., crops, genotypes, etc.).
- Each subsequent column represents a different criterion used for evaluation. For example, in crop selection, the columns could represent criteria like yield, pest resistance, water usage, or disease tolerance.
- Ensure that each row corresponds to a specific option, with the values under each criterion representing how that option performs with respect to the criteria.
Example of input format:
Option     | Yield | Water Usage | Pest Resistance | Disease Tolerance
----------------------------------------------------------------------
Crop A     | 80    | 200         | 70              | 65
Crop B     | 90    | 150         | 60              | 75
Crop C     | 85    | 180         | 80              | 70
After processing the input data with the assigned weights and the positive/negative impact of each criterion (sign), the software will generate an output file. The output will include an additional column that shows the rank of each option based on the TOPSIS method.
Output File Structure:
- The output will have the same columns as the input file, but with an additional rank column at the end.
- This rank column represents the position of each option in the ranking, based on how well it performs relative to all other options, considering the weights and the positive/negative impact of the criteria.
Example of output format:
Option     | Yield | Water Usage | Pest Resistance | Disease Tolerance | Rank
-------------------------------------------------------------------------
Crop A     | 80    | 200         | 70              | 65                 | 2
Crop B     | 90    | 150         | 60              | 75                 | 1
Crop C     | 85    | 180         | 80              | 70                 | 3
In this example, Crop B is ranked the highest (Rank 1) because it performed the best according to the weighted criteria and the positive/negative impacts defined for each criterion. The rank is computed using the TOPSIS method, which evaluates the proximity of each option to the ideal positive and negative solutions.